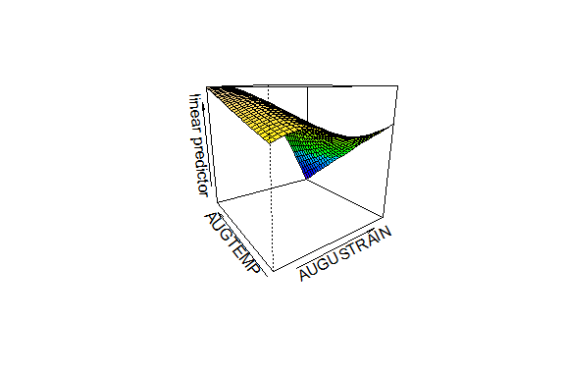
The yields of crops such as wheat are clearly affected by the amount of moisture available in the soil, as well as the temperature. More if generally better, but up to a point. Yields increase and then drop off. It looks like a reversed U-shaped curve. The usual way of modeling this would be with a quadratic term, that is including a squared term in the regression. That has been the approach taken by leading reasearchers looking into the effects of climate change on agriculture. But what if the two variables act on each other in a non-linear fashion? I have been working on this problem using regression splines, allowing the relationship to be flexible or ‘wiggly’. The estimation is non-parametric but so far seems to show more accurate results than the rather rigid parameterization of the quadratic method. The plot below shows wheat yields from the 1830s, against temperature and precipitation in August. The non-linearity is clear. I used the mgcv package in R for this. 
-
Recent Posts
Recent Comments
Nickolas on NYSE1996 Prices like this on NYSE1996 Prices image source on NYSE1996 Prices Over Here on NYSE1996 Prices stephenpeplow34 on Non-linear effects Archives
Categories
Meta
-
Join 4 other subscribers

The recent efforts by NASA might interest you: http://www.nasa.gov/content/goddard/nasas-aquarius-returns-global-maps-of-soil-moisture/#.U8f3KSgZHVg
The UN estimates from statistical data that 65-70% of water use is for agriculture, thus it’s startling to witness maps of soil moisture showing massive swaths of drying during crop seasons.
LikeLike
Thanks, that is very interesting. Some people believe that there will be ‘water wars’ in the future as states fight over this vital resource. What we need to remember of course is that a great deal of exported agricultural produce is actually made up of water (eg wheat). So countries such as Australia are exporting a vital resource
LikeLike